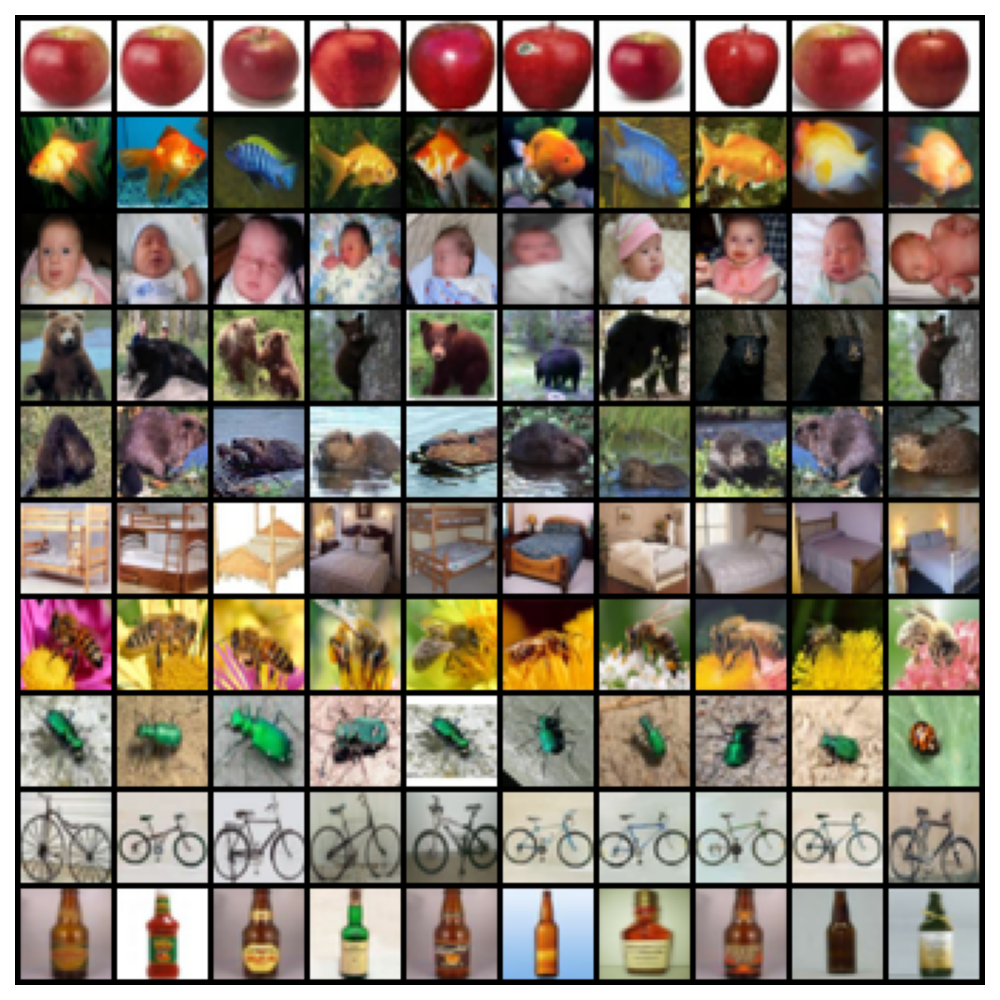
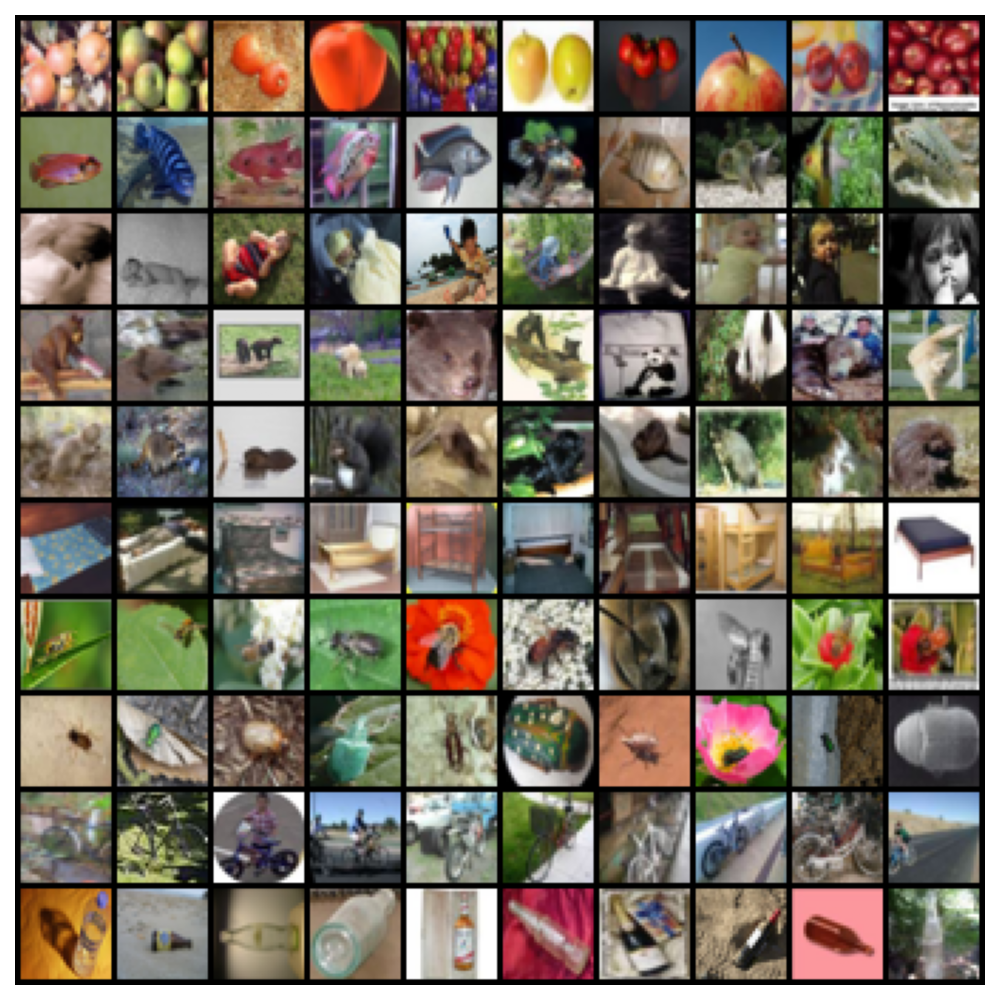
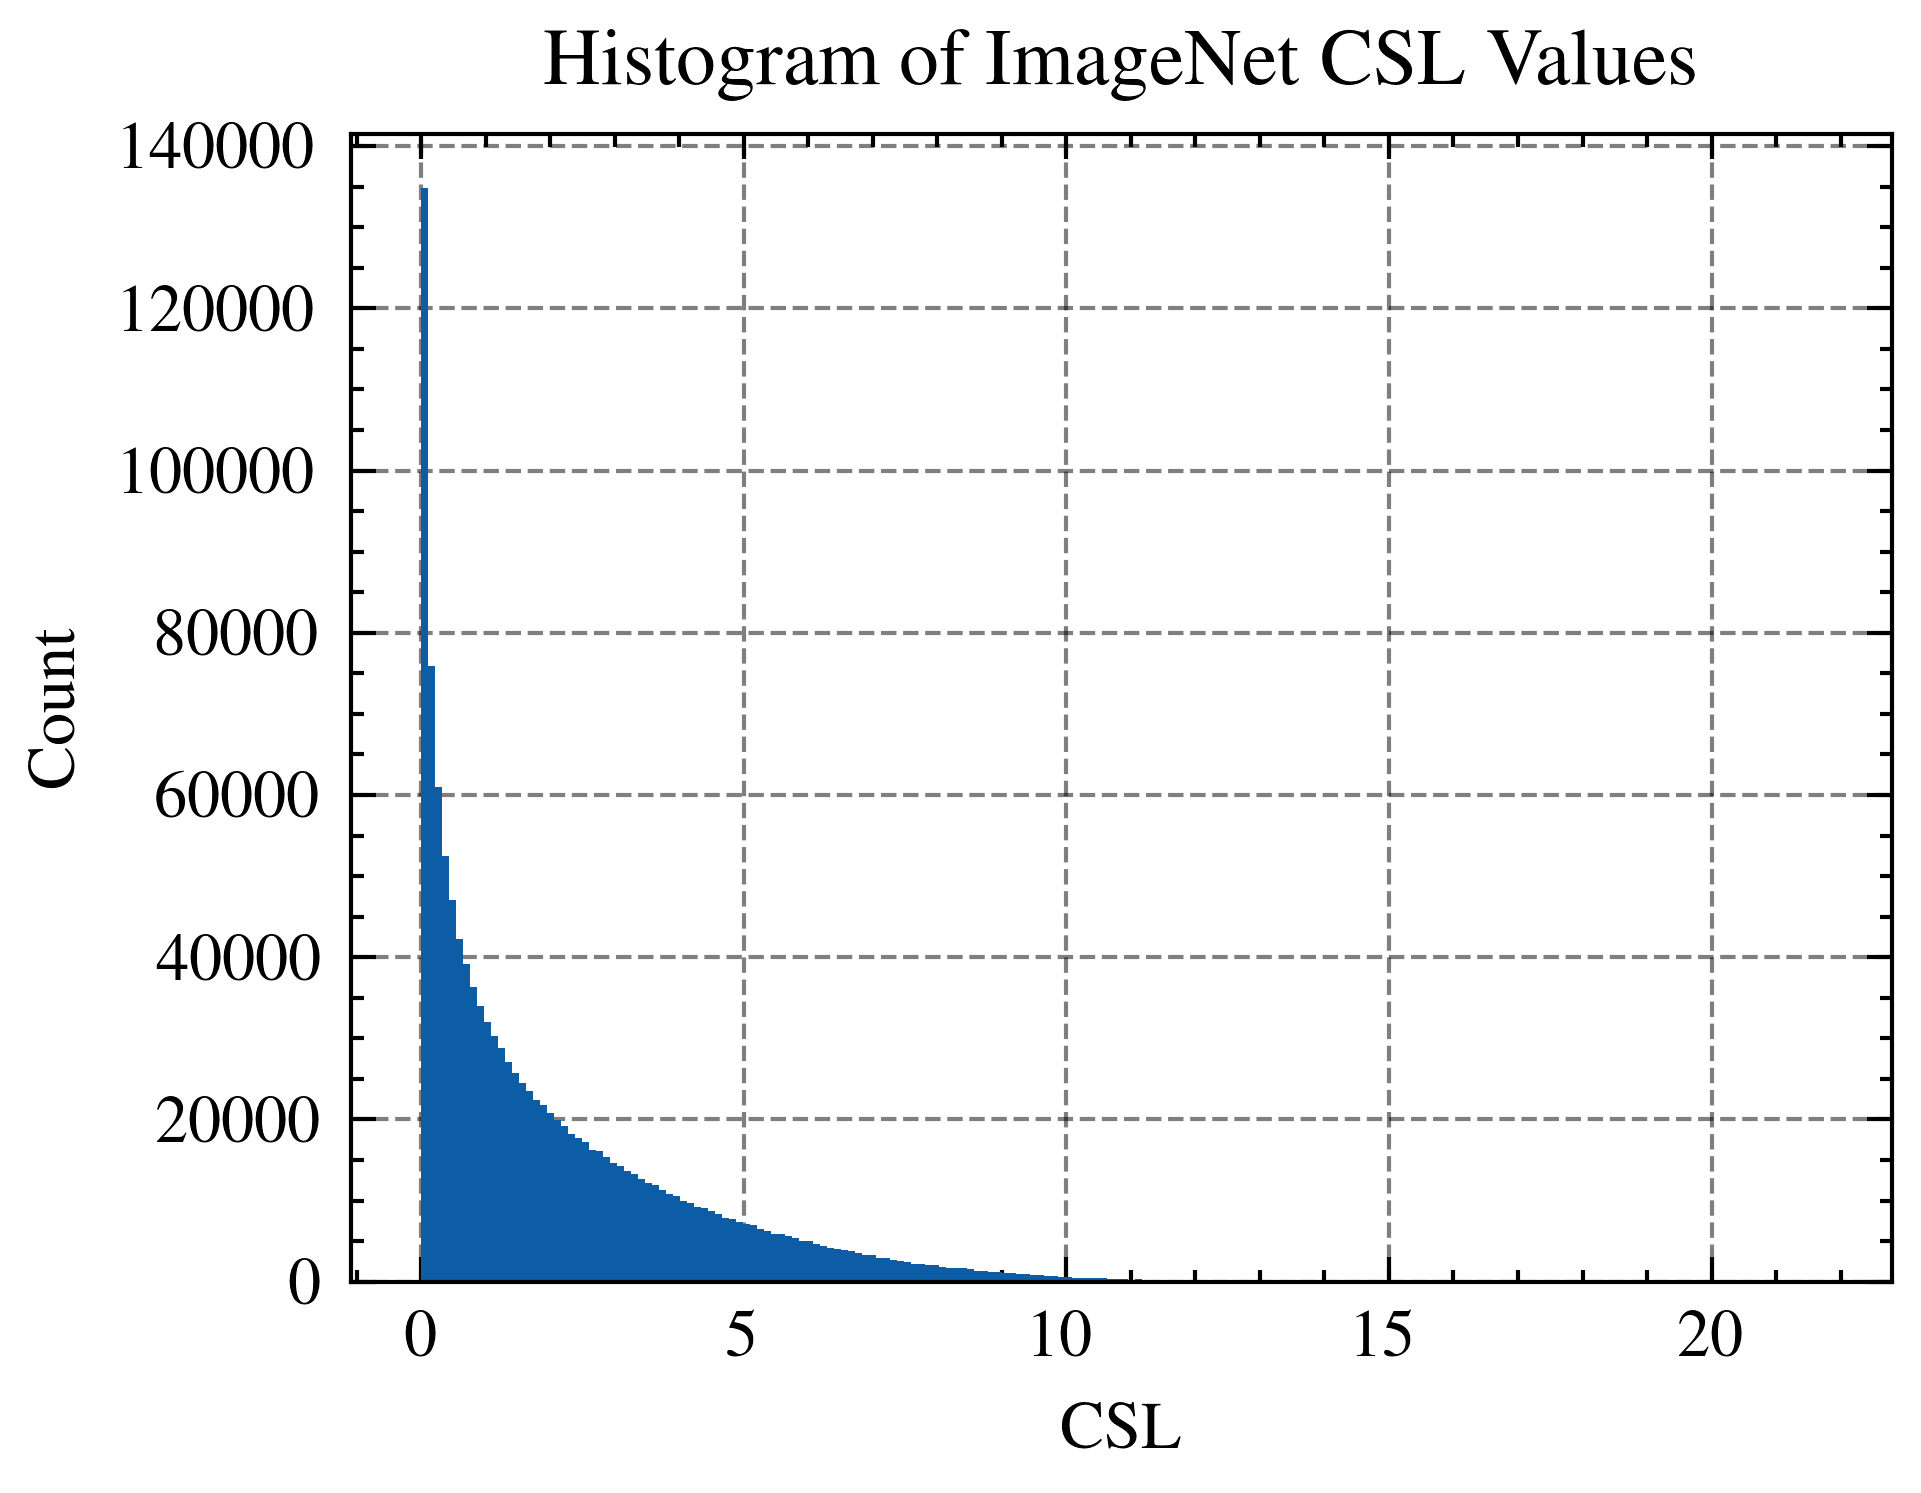
| CIFAR-10 |
Thr. Learning Time (LT) |
0.4969 ± 0.0041 |
0.4981 ± 0.0004 |
0.4977 ± 0.0020 |
0.4988 ± 0.0028 |
| In Conf. [Carlini et al.] |
0.6224 ± 0.0130 |
0.5978 ± 0.0131 |
0.5800 ± 0.0051 |
0.5669 ± 0.0106 |
| CL [Northcutt et al.] |
0.7345 ± 0.1672 |
0.7169 ± 0.1539 |
0.6960 ± 0.1387 |
0.6794 ± 0.1264 |
| SSFT [Maini et al.] |
0.9233 ± 0.0029 |
0.9077 ± 0.0023 |
0.8910 ± 0.0050 |
0.8710 ± 0.0071 |
| Loss Curvature [Garg et al.] |
0.9827 ± 0.0019 |
0.9834 ± 0.0019 |
0.9849 ± 0.0014 |
0.9834 ± 0.0019 |
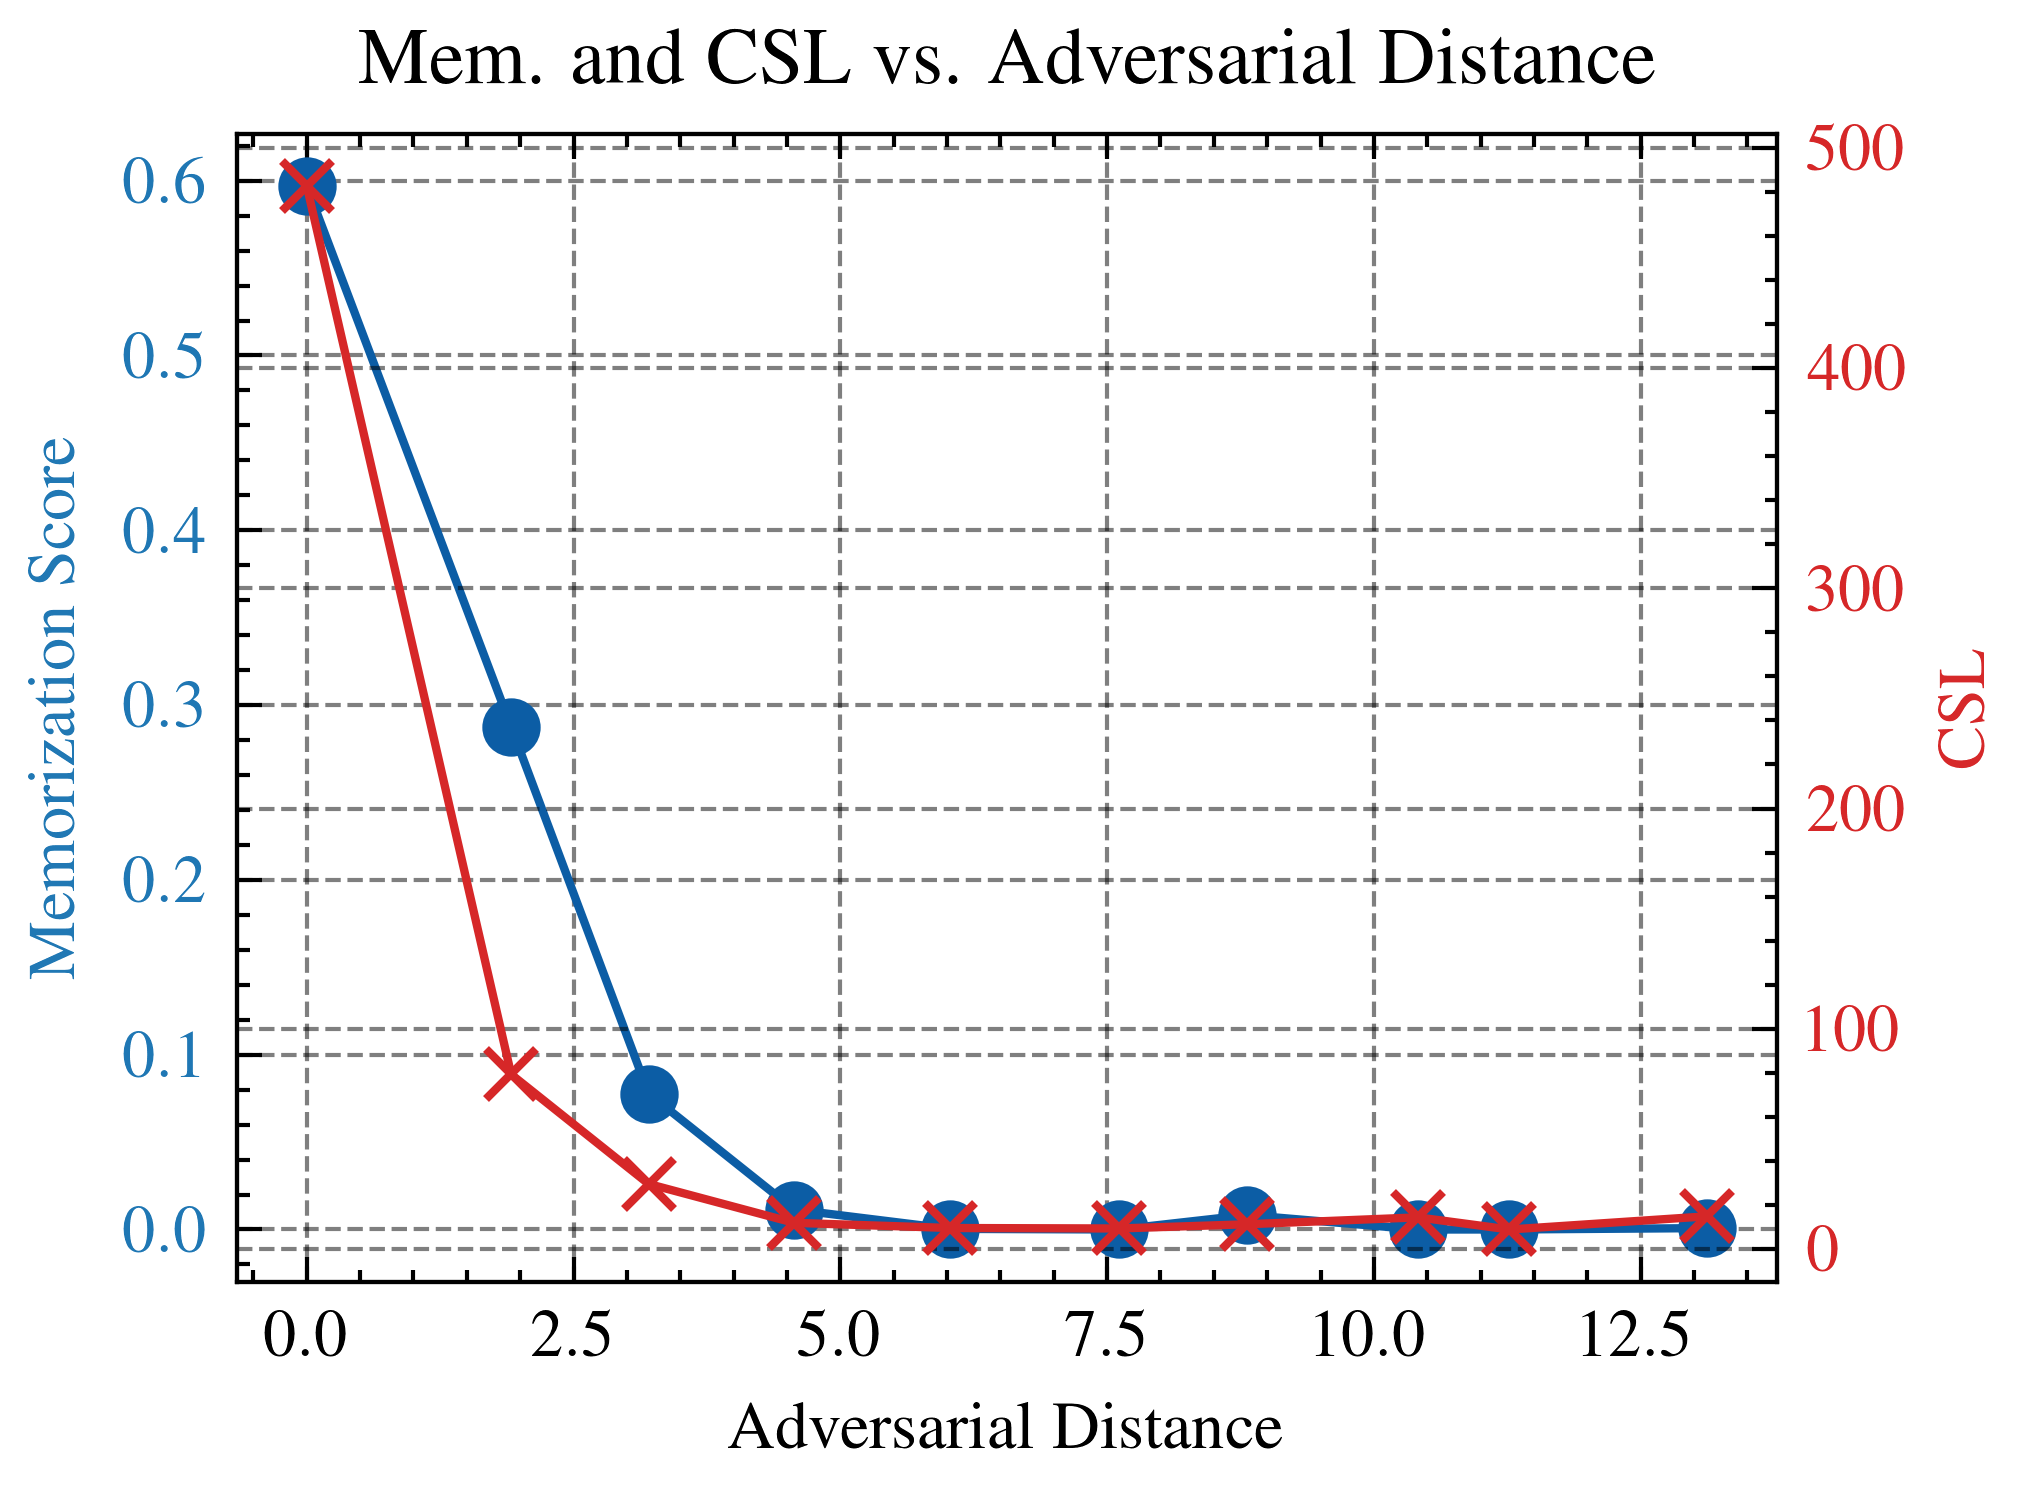
| CSL (Ours) |
0.9867 ± 0.0007 |
0.9870 ± 0.0003 |
0.9869 ± 0.0007 |
0.9866 ± 0.0009 |
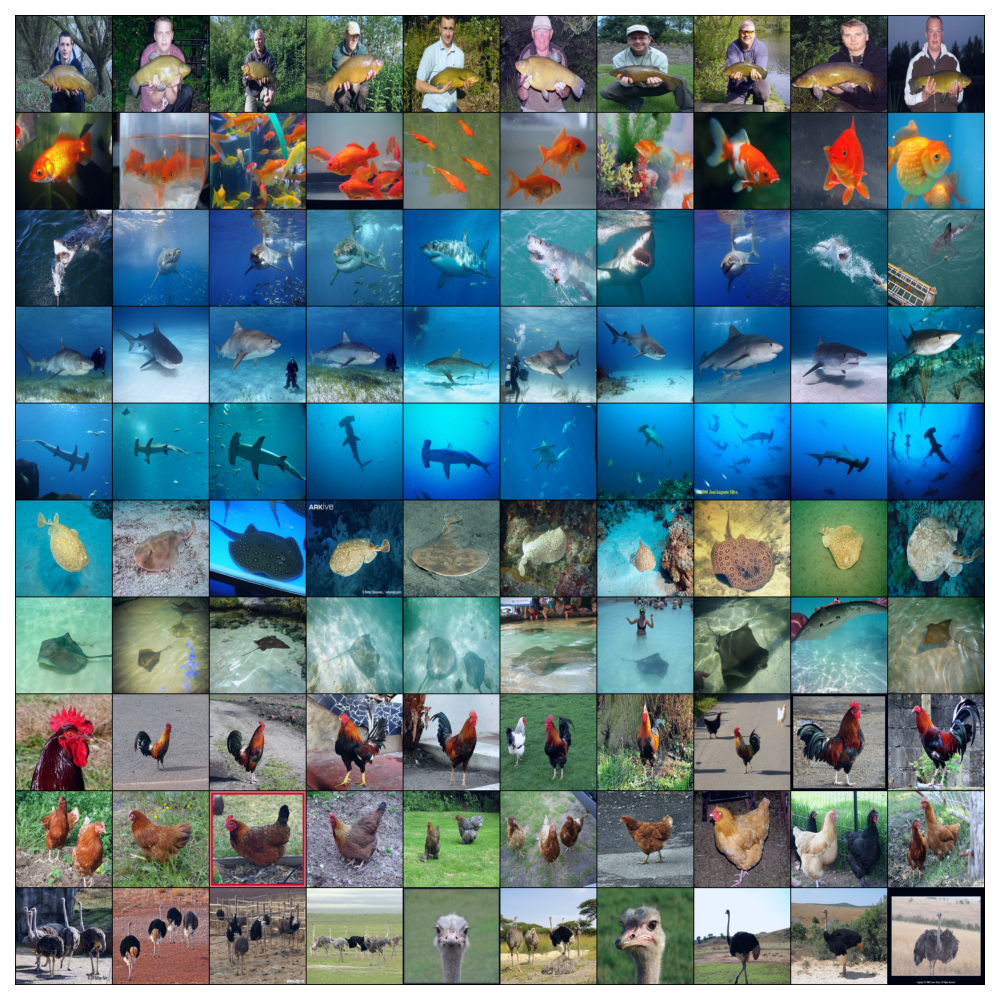
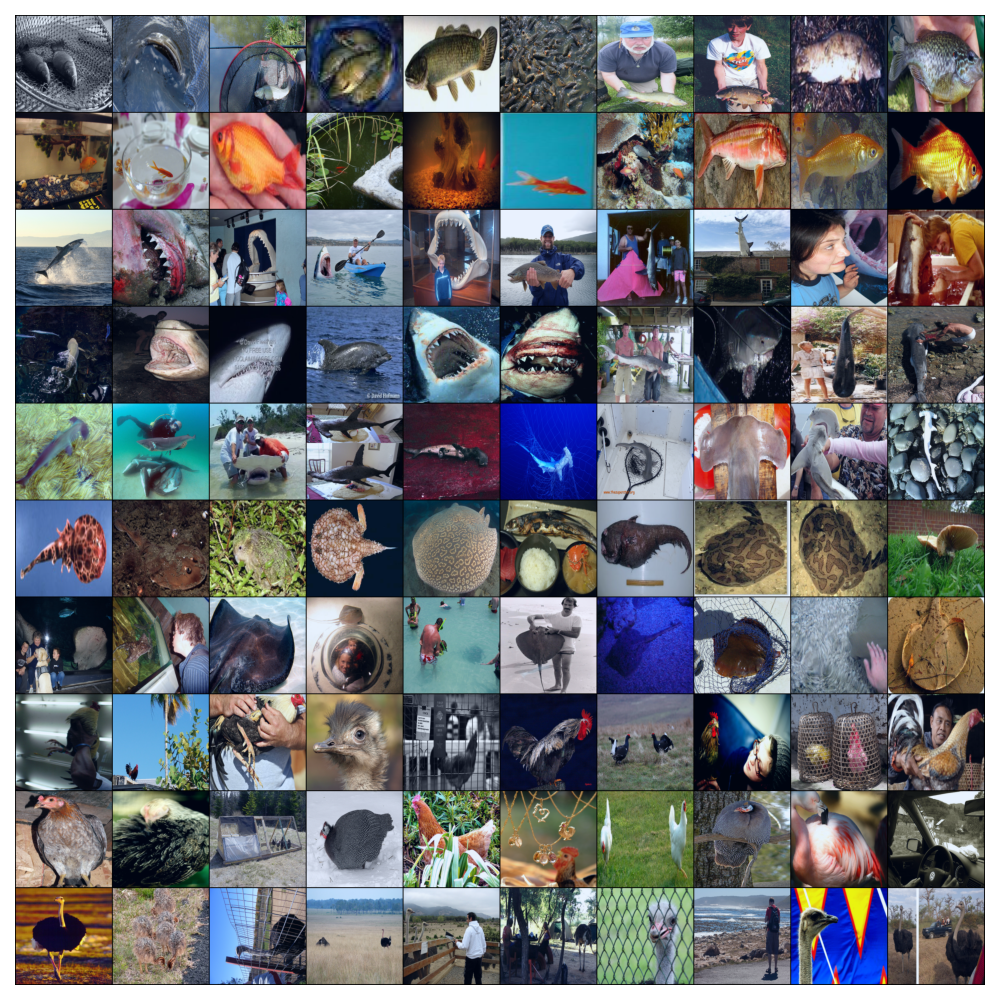
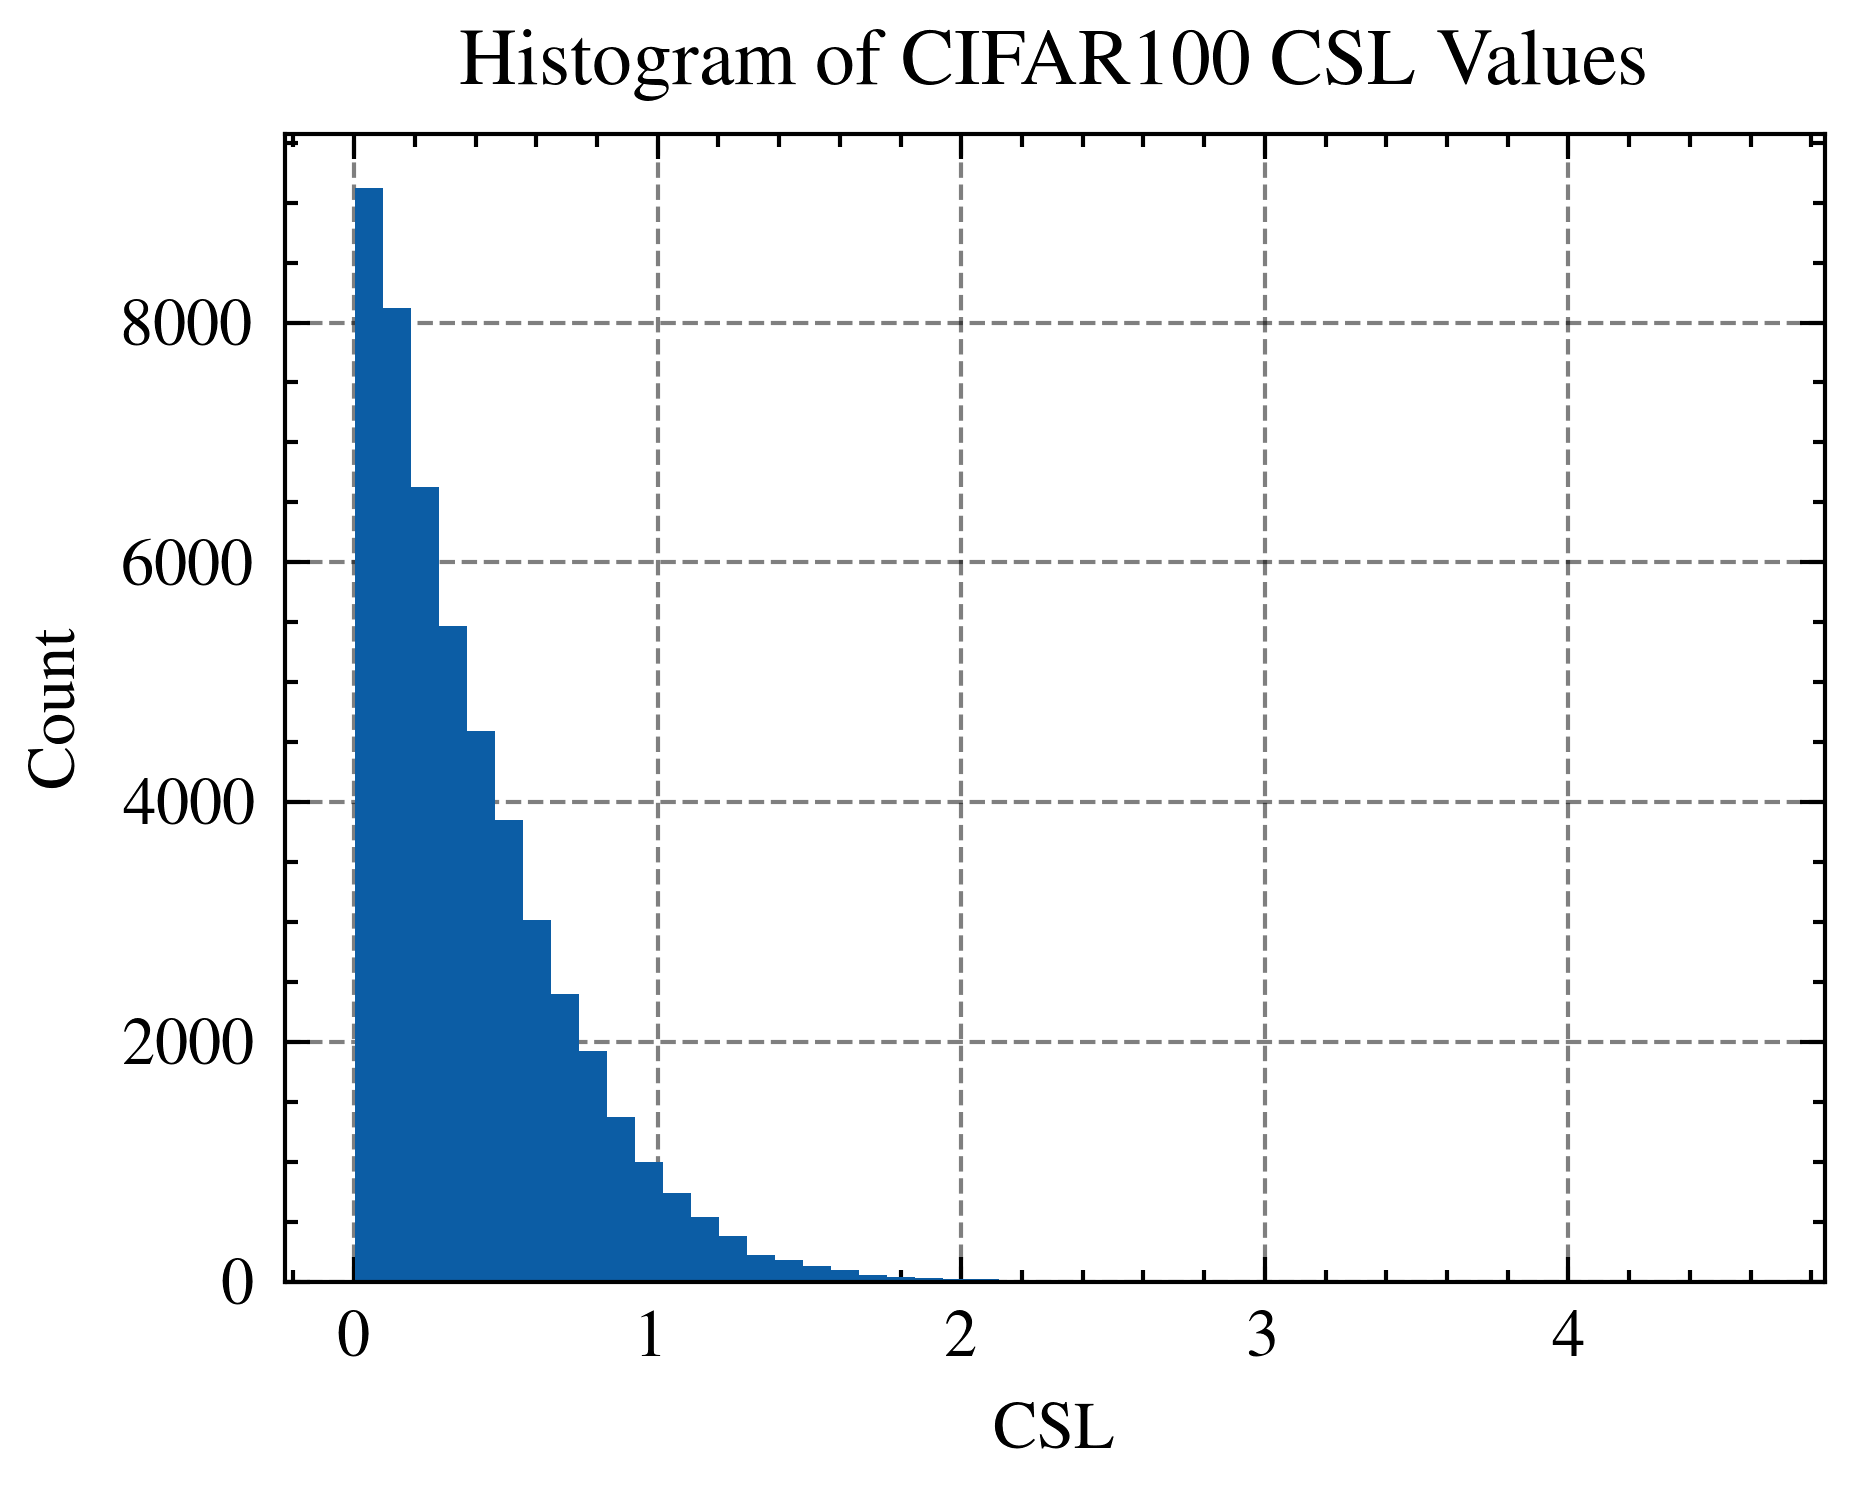
| CIFAR-100 |
Thr. Learning Time (LT) |
0.5144 ± 0.0017 |
0.5119 ± 0.0059 |
0.5069 ± 0.0050 |
0.5041 ± 0.0002 |
| In Conf. [Carlini et al.] |
0.6706 ± 0.0052 |
0.6493 ± 0.0075 |
0.6324 ± 0.0051 |
0.6257 ± 0.0044 |
| CL [Northcutt et al.] |
0.7233 ± 0.1707 |
0.7030 ± 0.1565 |
0.6833 ± 0.1427 |
0.6662 ± 0.1289 |
| SSFT [Maini et al.] |
0.8495 ± 0.0002 |
0.8358 ± 0.0008 |
0.8203 ± 0.0016 |
0.8043 ± 0.0061 |
| Loss Curvature [Garg et al.] |
0.9886 ± 0.0009 |
0.9887 ± 0.0013 |
0.9885 ± 0.0016 |
0.9888 ± 0.0004 |
| CSL (Ours) |
0.9898 ± 0.0003 |
0.9897 ± 0.0003 |
0.9899 ± 0.0003 |
0.9899 ± 0.0002 |